Having looked at many analytics tools and dashboards, I was always impressed what vendors came up with to show some value of their tools. The latest trend, that especially SEO Tools like Searchmetrics, Sistrix Toolbox and SEOlytics came up with, was a so-called
“Visibility Index”, which aims to tell the visibility of a website in the search engines.
Visibility is something extremely tough to measure and unless you run an entire proxy server farm in several continents, you’ll probably have an issue getting really valuable data.
On top of that we are in the days where social media can drive more traffic than a search engine and visilibity in the organic rankings might be interesting, but the really valuable traffic might come from a Youtube video, which a visitors placed on Facebook and promoted through Twitter.
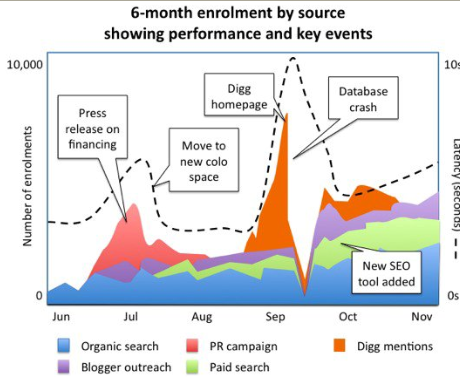
That said…I saw an intresting graph over at Marshall’s blog: the 6-month performance an key events report (see below). What a beautiful graph to show how a website is doing! I hope one of the vendors pick up the idea and generate a dashboard report, which not only displays the webanalytics data and 3rd party products (via API), but also allows the user to include key events such as “Database crash” or “New SEO tool added”.

Spirit Incentives with Lead411.com
Your best bet in Myrtle Beach Hotels via Tripadvisor.com
Microsoft Kin Accessories available now at Onlykin.com
online masters degrees